The field of science and engineering most relevant to electrophysiology and bioelectromagnetism is electrical engineering. However, the electrical engineering student will quickly note some important distinctions in emphasis between these disciplines. Much of electrical engineering deals with networks made up of batteries, resistances, capacitances, and inductors. Each of these elements, while actually comprising a physical object, is considered to be discrete. Electric circuits and electric networks have been extensively studied to elucidate the properties of their structures.
 In electrophysiology and bioelectromagnetism there are no inductors, while resistances, capacitances, and batteries are not discrete but distributed. That is, the conducting medium extends continuously; it is three-dimensional and referred to as a volume conductor. Although the capacitance is localized to cellular membranes, since normally our interest is in multicellular preparations (e.g., brain tissue or cardiac muscle) which extend continuously throughout a three-dimensional region, the capacitance must also be deemed to be distributed. In fact, this is true as well for the "batteries," which are also continuously distributed throughout these same membranes.
 Although the classical studies in electricity and magnetism are relevant, it is the area of electromagnetic fields that is the most pertinent. Such application to volume conductors is discussed later in detail in Chapter 11, where it is shown that they form an independent and logical discipline. Wherever possible, results from the simple sources discussed in the earlier chapters will be applied under more realistic conditions.
 A major object of this chapter is to introduce the bioelectric sources and the electric fields arising from the sources. Another important task is to discuss the concept of modeling. It is exemplified by modeling the bioelectric volume sources, like those within the entire heart, and volume conductors, like the entire human body. This chapter provides also a preliminary discussion of the fundamental problems concerning the bioelectric or biomagnetic fields arising from the sources, called the solutions to the forward problem, and the general preconditions for the determination of the sources giving a description of the field, called the solutions to the inverse problem. The discussion on bioelectric sources and the fields that they produce is continued on a theoretical basis in Chapter 8.
7.2 BIOELECTRIC SOURCE AND ITS ELECTRIC FIELD
7.2.1 Definition of the Preconditions
The discussions in each section that follows are valid under a certain set of conditions - that is, for certain types of electric sources within certain types of volume conductors. Therefore, some limiting assumptions, or preconditions, are given first. One should note that when the preconditions are more stringent than the actual conditions the discussion will necessarily be valid. For instance, if the preconditions indicate the discussion is valid in an infinite homogeneous volume conductor, then it is not valid in a finite inhomogeneous volume conductor. On the other hand, if the preconditions indicate the discussion is valid in a finite inhomogeneous volume conductor, then it is also valid in a finite homogeneous volume conductor because the latter is a special case of the former.
7.2.2 Volume Source in a Homogeneous Volume Conductor
PRECONDITIONS:
Let us introduce the concept of the impressed current density
The quantity s
Equation 7.3 is a partial differential equation satisfied by F in which
Since a source element -
This equation represents the distribution of potential F due to the bioelectric source
7.2.3 Volume Source in an Inhomogeneous Volume Conductor
PRECONDITIONS:
In Section 7.2.2 it was assumed that the medium is uniform (i.e., infinite and homogeneous). Such an assumption allowed the use of simple expressions that are valid only for uniform homogeneous media of infinite extent. However, even an in vitro preparation that is reasonably homogeneous is nevertheless bounded by air, and hence globally inhomogeneous. One can take such inhomogeneities into account by adding additional terms to the solution. In this section we consider inhomogeneities by approximating the volume conductor by a collection of regions, each one of which is homogeneous, resistive, and isotropic, where the current density
where the primed and double-primed notations represent the opposite sides of the boundary and
If we make the choice of Y = 1/r, where r is the distance from an arbitrary field point to the element of volume or area in the integration, and F is the electric potential, and substitute Equations 7.3, 7.6, and 7.7 into Equation 7.8, then we obtain the following useful result (Geselowitz, 1967):
This equation evaluates the electric potential anywhere within an inhomogeneous volume conductor containing internal volume sources.
7.2.4 Quasistatic Conditions
In the description of the volume conductor constituted by the human body, the capacitive component of tissue impedance is negligible in the frequency band of internal bioelectric events, according to the experimental evidence of Schwan and Kay (1957). They showed that the volume conductor currents were essentially conduction currents and required only specification of the tissue resistivity. The electromagnetic propagation effect can also be neglected (Geselowitz, 1963).
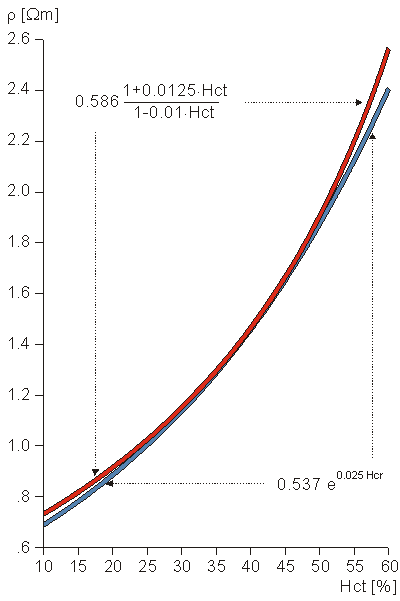
Fig. 7.4. Resistivity of blood as a function of hematocrit (Hct). Equations 7.11 and 7.12 are depicted in graphical form.
7.4.2 Modeling the Head
The brain is composed of excitable neural tissue, the study of which is of great interest in view of the vital role played by this organ in human function. Its electric activity, readily measured at the scalp, is denoted the electroencephalogram (EEG). Brain tissue not only is the location of electric sources (generators), but also constitutes part of the volume conductor which includes also the skull and scalp.
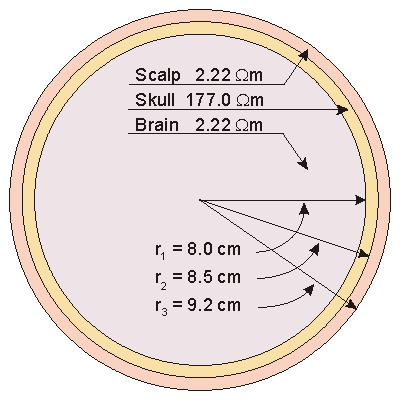
Fig. 7.5. Concentric spherical head model by Rush and Driscoll (1969). The model contains a region for the brain, scalp, and skull, each of which is considered to be homogeneous.
7.4.3 Modeling the Thorax
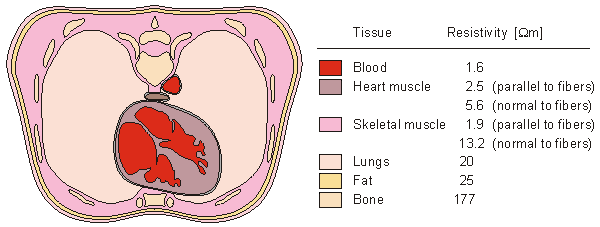
The applied electrophysiological preparation that has generated the greatest interest is that of electrocardiography. The electric sources (generators) lie entirely within the heart, whereas the volume conductor is composed of the heart plus remaining organs in the thorax. Rush, Abildskov, and McFee (1963) introduced two simple models of the thorax. In both, the outer boundary has the shape of a human thorax. In the simpler model, the resistivity of the lungs is selected at 10 Wm. The intracardiac blood is assigned a resistivity of 1 Wm. In the more accurate model, the resistivity of the lungs is chosen to be 20 Wm. In addition, the cardiac muscle and intercostal muscles are modeled with a resistivity of 4 Wm, and the intracardiac blood is assigned a resistivity of 1.6 Wm, as described in Figure 7.6. Because the experimentally found tissue resistivity shows a considerable variation, a similarly wide choice of values are used in thorax models.
7.5 FORWARD AND INVERSE PROBLEM
7.5.1 Forward Problem
The problem in which the source and the conducting medium are known but the field is unknown and must be determinated, is called the forward problem. The forward problem has a unique solution. It is always possible to calculate the field with an accuracy that is limited only by the accuracy with which we can describe the source and volume conductor. However, this problem does not arise in clinical (diagnostic) situations, since in this case only the field can be measured (noninvasively) at the body surface.
7.5.2 Inverse Problem
The problem in which the field and the conductor are known but the source is unknown, is called the inverse problem (see Figure 7.7). In medical applications of bioelectric phenomena, it is the inverse problem that has clinical importance. For instance, in everyday clinical diagnosis the cardiologist and the neurologist seek to determine the source of the measured bioelectric or biomagnetic signals. The possible pathology affecting the source provides the basis for their diagnostic decisions - that is, the clinical status of the corresponding organ. What is the feasibility of finding solutions to the inverse problem? This will be discussed in the next section.
7.5.3 Solvability of the Inverse Problem
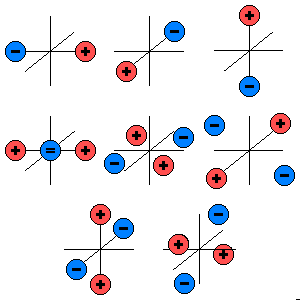
Let us discuss the solvability of the inverse problem with a simplified example of a source and a conductor (Figure 7.8). In this model the source is represented by a single battery, and the conductor by a network of two resistors (McFee and Baule, 1972). Three cases are presented in which the voltage source is placed in different locations within the network and given different values. Note that although the magnitude of the battery voltage is different in each case, the output voltage in all three cases is the same, namely 2 V.
7.5.4 Possible Approaches to the Solution of the Inverse Problem
Cardiac electric activity can be measured on the surface of the thorax as the electrocardiogram. Similarly, the electromyogram, electroencephalogram, and so on, are signals of muscular, neural, and other origins measured noninvasively at the body surface. The question facing the clinician is to determine the electric source (generator) of the measured signal and then to observe whether such source is normal or in what way it is abnormal.
An empirical approach based on the recognition of typical signal patterns that are known to be associated with certain source configurations.
Imposition of physiological constraints is based on the information available on the anatomy and physiology of the active tissue. This imposes strong limitations on the number of available solutions.
Examining the lead-field pattern, from which the sensitivity distribution of the lead and therefore the statistically most probable source configuration can be estimated.
Modeling the source and the volume conductor using simplified models. The source is characterized by only a few degrees of freedom (for instance a single dipole which can be completely determined by three independent measurements).
We discuss these approaches in more detail in the following:
The Empirical Approach
Imposition of Physiological Constraints
Lead Field Theoretical Approach
Simplified Source Model A model is constructed for the signal source. The model should have a limited number of independent variables yet still have good correspondence with the physiology and anatomy associated with the actual source distribution.
A model is constructed for the volume conductor. The accuracy of the conductor model must be as good as or better than that of the source model.
At least as many independent measurements are made as the model has independent variables. Now we have as many equations as we have unknowns, and the variables of the model can be evaluated.
7.5.5 Summary
In Section 7.5 we have described the problem of clinical interest in electrocardiography, magnetocardiography, electroencephalography, magnetoencephalography, etc. as the solution of an inverse problem. This solution involves determination of the source configuration responsible for the production of the electric signals that are measured. Knowledge of this distribution permits clinical diagnoses to be made in a straightforward deterministic way.
 It should be noted that all volume conductors are assumed to be linear (consistent with all experimental evidence). If the volume conductor is presumed to be homogeneous, it is assumed to be isotropic as well. The various types of sources and conductors are characterized later in this chapter.
SOURCE: Volume source
CONDUCTOR: Infinite, homogeneous
 i(x,y,z,t). This is a nonconservative current, that arises from the bioelectric activity of nerve and muscle cells due to the conversion of energy from chemical to electric form. The individual elements of this bioelectric source behave as electric current dipoles. Hence the impressed current density equals the volume dipole moment density of the source. Note that
  i is zero everywhere outside the region of active cells (Plonsey, 1969). (Note also that bioelectric sources were formerly modeled by dipoles or double layers formed by the component electric charges. Today we think of the current source as the basic element.)
 If the volume conductor is infinite and homogeneous and the conductivity is s, the primary sources
  i establish an electric field
  and a conduction current s
 . As a result, the total current density (Geselowitz, 1967) is given by:


(7.1)  is often referred to as the return current. This current is necessary to avoid buildup of charges due to the source current.
 Because the electric field
  is quasistatic (see Section 7.2.4), it can be expressed at each instant of time as the negative gradient of a scalar potential F, and Equation 7.1 may be rewritten


(7.2)  Since the tissue capacitance is negligible (quasistatic conditions), charges redistribute themselves in a negligibly short time in response to any source change. Since the divergence of
  evaluates the rate of change of the charge density with respect to time, and since the charge density must be zero, the divergence of
  is necessarily zero. (We refer to the total current
  as being solenoidal, or forming closed lines of current flow.) Therefore, Equation 7.1 reduces to Poisson's equation:


(7.3) 

 i is the source function (or forcing function).
 The solution of Equation 7.3 for the scalar function sF for a region that is uniform and infinite in extent (Stratton, 1941) is:


(7.4) 

 idv in Equation 7.4 behaves like a point source, in that it sets up a field, that varies as 1/r (as will be explained in more detail later in Equation 8.35), the expression -

 i is defined as a flow source density (IF). Because we seek the solution for field points outside the region occupied by the volume source, Equation 7.4 may be transformed (Stratton, 1941) to:


(7.5)  i within an infinite, homogeneous volume conductor having conductivity s. Here
  idv behaves like a dipole element (with a field that varies as its dot product with
  (1/r), and hence
  i can be interpreted as a volume dipole density).
 In this section we started with a formal definition of
  i as an impressed current density (a nonconservative vector field) and developed its role as a source function of potential fields. These are expressed by Equations 7.4 and 7.5. But identical expressions will be obtained in Chapter 8 (namely Equations 8.34 and 8.32) based on an interpretation of
  i as a dipole moment per unit volume. This underscores the dual role played by the distribution
  i, and provides alternative ways in which it can be evaluated from actual experiments. (One such approach will be illustrated in Chapter 8.) These alternate interpretations are, in fact, illustrated by Equations 7.4 and 7.5.
SOURCE: Volume source
CONDUCTOR: Inhomogeneous
 i is linearly related to the electric field intensity
  (Schwan and Kay, 1956). We show that such inhomogeneities can be taken into account while at the same time retaining the results obtained in Section 7.2.2 (which were based on the assumption of uniformity).
 An inhomogeneous volume conductor can be divided into a finite number of homogeneous regions, each with a boundary Sj. On these boundaries both the electric potential F and the normal component of the current density must be continuous:


(7.6) 

(7.7)  j is directed from the primed region to the double-primed one.
 If dv is a volume element, and Y and F are two scalar functions that are mathematically well behaved in each (homogeneous) region, it follows from Green's theorem (Smyth, 1968) that


(7.8)


(7.9)  The first term on the right-hand side of Equation 7.9 involving
  i corresponds exactly to Equation 7.5 and thus represents the contribution of the volume source. The effect of inhomogeneities is reflected in the second integral, where (sj" - sj' )F
 j is an equivalent double layer source (
 j is in the direction of d
 j ). The double layer direction, that of
  j or d
 j, is the outward surface normal (from the prime to double-prime region). This can be emphasized by rewriting Equation 7.9 as


(7.10)  Note that the expression for the field from
  i (involving
  (1/r)) is in exactly the same form as (sj" - sj' ) F
 j, except that the former is a volume source density (volume integral) and the latter a surface source density (surface integral). In Equations 7.9 and 7.10, and previous equations, the gradient operator is expressed with respect to the source coordinates whereupon
  (1/r) =
  r /r 2 and
  r is from the source to field. The volume source
  i is the primary source, whereas the surface sources that are invoked by the field established by the primary source (therefore secondary to that source) are referred to as secondary sources.
 We want to point out once again that the first term on the right-hand side of Equation 7.9 describes the contribution of the volume source, and the second term the contribution of boundaries separating regions of different conductivity - that is, the contribution of the inhomogeneities within the volume conductor. This may be exemplified as follows: If the conductivity is the same on both sides of each boundary Sj - that is, if the volume conductor is homogeneous - the difference (s"j - s'j) on each boundary Sj in the second term is zero, and Equation 7.9 (applicable in an inhomogeneous volume conductor) reduces to Equation 7.5 (applicable in a homogeneous volume conductor).
 The purpose of measuring bioelectric signals is to measure their source, not the properties of the volume conductor with the aid of the source inside it. Therefore, the clinical measurement systems of bioelectric events should be designed so that the contribution of the second term in Equation 7.9 is as small as possible. Later, Chapter 11 introduces various methods for minimizing the effect of this term.
 Equation 7.9 includes a special case of interest in which the preparation of interest (e.g., the human body) lies in air, whereupon s"j = 0 corresponding to the bounding nonconducting space.
 This condition implies that time-varying bioelectric currents and voltages in the human body can be examined in the conventional quasistatic limit (Plonsey and Heppner, 1967). That is, all currents and fields behave, at any instant, as if they were stationary. The description of the fields resulting from applied current sources is based on the understanding that the medium is resistive only, and that the phase of the time variation can be ignored (i.e., all fields vary synchronously).
 r = 0.537 e0.025Hct
 (7.11)  Hugo Fricke studied theoretically the electric conductivity of a suspension of spheroids (Fricke, 1924). When applying this method to the conductivity of blood, we obtain what is called the Maxwell-Fricke equation:


(7.12)
where r = resistivity of blood [Wm] Hct = hematocrit [%]  Both of these equations give very accurate values. The correlation coefficient of Equation 7.11 to empirical measurements is r = 0.989. Because the best fitting curve to the measured resistivity values is slightly nonlinear in a semilogarithmic plot, Equation 7.12 gives better values with very low or very high hematocrit values. The resistivity of blood is also a function of the movement of the blood (Liebman, Pearl, and Bagnol, 1962; Tanaka et al., 1970). This effect is often neglected in practice. Equations 7.11 and 7.12 are presented in Figure 7.4..
 Regarding volume conductor models, the head has been successfully considered to be a series of concentric spherical regions (the aforementioned brain, skull, and scalp), as illustrated in Figure 7.5 (Rush and Driscoll, 1969). In this model, the inner and outer radii of the skull are chosen to be 8 and 8.5 cm, respectively, while the radius of the head is 9.2 cm. For the brain and the scalp a resistivity of 2.22 Wm is selected, whereas for the skull a resistivity of 80 × 2.22 Wm = 177 Wm is assigned. These numerical values are given solely to indicate typical (mean) physiological quantities. Because of the symmetry, and simplicity, this model is easy to construct as either an electrolytic tank model or a mathematical and computer model. It is also easy to perform calculations with a spherical geometry. Though this simple model does not consider the anisotrophy and inhomogeneity of the brain tissue and the cortical bone (Saha and Williams, 1992), it gives results that correspond reasonably well to measurements.
 In a first-order electrocardiographic (and particularly in a magnetocardiographic) model, the whole heart can be considered to be uniform and spherical. In a second-order model, the left ventricular chamber can be modeled with a sphere of a radius of 5.6 cm and hence a volume of 736 cm3; the cavity is assumed to be filled with blood.
 In more recent years, several models have been developed which take into account both shape as well as conductivity of the heart, intracavitary blood, pericardium, lungs, surface muscle and fat, and bounding body shape. These include models by Rudy and Plonsey (1979) and Horá ek (1974). A physical inhomogeneous and anisotropic model of the human torso was constructed and described by Rush (1971). This has also been used as the basis for a computer model by Hyttinen et al. (1988).
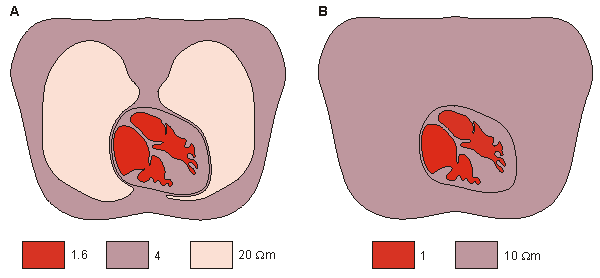
Fig. 7.6. Simplified thorax models by Rush (1971).
(A) Heart, lung, and blood regions are identified.
(B) The lung region is made uniform with the heart and surface muscle.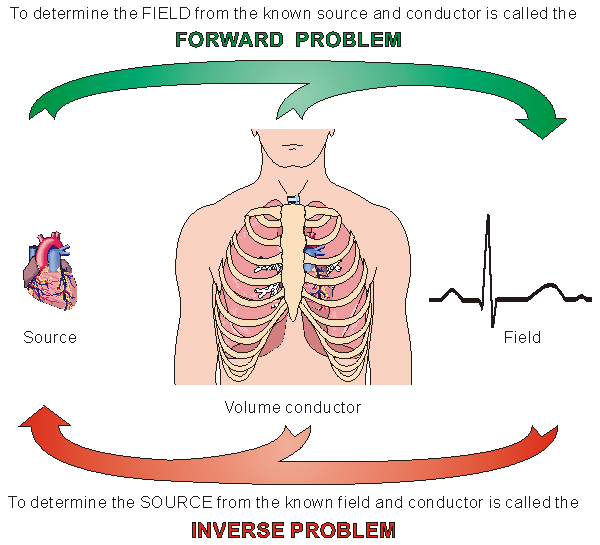
Fig. 7.7. Forward and inverse problems.
 One may examine each network with Thevenin's theorem (or its dual Norton's theorem), which states that it is always possible to replace a combination of voltage sources and associated circuitry with a single equivalent source and a series impedance. The equivalent emf is the open-circuit voltage, and the series resistance is the impedance looking into the output terminals with the actual sources short-circuited.
 With this approach, we can evaluate the Thevenin equivalent for the three given circuits. In all cases the equivalent network is the same, namely an emf of 2 V in series with a resistance of 4 W. This demonstrates that based on external measurements one can evaluate only the Thevenin network. In this example, we have shown that this network is compatible with (at least) three actual, but different, networks. One cannot distinguish among these different inverse candidates without measurements within the source region itself. The example demonstrates the lack of uniqueness in constructing an inverse solution.
 The solvability of the inverse problem was discussed through the use of a simple electronic circuit as an example. The first theoretical paper, which stated that the inverse problem does not have a unique solution, was written by Hermann von Helmholtz (1853)..

Fig. 7.8. Demonstration of the lack of uniqueness in the inverse problem.
 To find the source, given the measured field, is the statement of the inverse problem. As noted above, a unique solution cannot be found based on external measurements alone. One may therefore ask how it is possible to reach a clinical diagnosis. Despite the discouraging demonstration in the previous section of the theorem regarding the lack of uniqueness of the inverse problem, there are several approaches that overcome this dilemma. Four of these approaches are discussed below:
The empirical approach is based on the experience of the physician to recognize typical signal patterns associated with certain disorders. This means, that the diagnosis is based on the comparison of the recorded signal to a catalog of patterns associated with clinical disorders. If the signal is identified, the diagnosis can be made. This process has been formalized using a diagnostic tree. The diagnosis is reached through a sequence of logical steps that are derived statistically from the accumulated data base. This very same procedure may also be followed in creating a computer program to automate the diagnostic process (Macfarlane and Lawrie, 1974).
As noted, there is no unique solution to the inverse problem. By this we mean that more than one source configuration will generate fields that are consistent with the measurements (as demonstrated in Section 7.5.3). However, it may be possible to select from among these competing solutions one that at the same time meets physiological expectations. We say that this procedure involves the imposition of physiological constraints. Those that have been used successfully include a requirement that dipole sources point outward, that the activation sequence be continuous, that the signal and noise statistics lie in expected ranges, and so on (Pilkington and Plonsey, 1982).
It is possible to determine what is known as the sensitivity distribution of the lead. (To obtain it, we consider the relative voltage that would be measured at a lead as a function of the position and orientation of a unit dipole source; the lead sensitivity at a point is the relative lead voltage for a dipole whose direction is adjusted for maximum response.) One can then make decisions about the activity of the source based upon this information. This approach depends on the fact that each lead detects the component of the activation dipoles that are in the direction of the sensitivity of the lead.
 For all leads and for a statistically homogeneously distributed source the source of the detected signal is most probably located at that region of the source where the lead sensitivity is highest and oriented in the direction of the lead sensitivity. If the lead system is designed to detect certain equivalent source like dipole, quadrupole etc., the detected signal represents this equivalent source which is a simplified model of the real source. It must be pointed out that while this simplified model is not necessarily the source, it probably represents the main configuration of the source. This approach is discussed in detail later.
The inverse problem may be solved by modeling the source of the bioelectric or biomagnetic signal and the volume conductor in the following way (Malmivuo, 1976; see Figure 7.9):
 At this point, the following question is of paramount importance: How good is the correspondence between the model and the actual physiology?
 In the modeling method, certain practical considerations should be noted. First, to reduce the sensitivity to noise (both in the measured voltages and the measured geometry), the number of independent measurements at the body surface usually must greatly exceed the number of variables in the source model. The overspecified equations are then solved using least squares approximation (and possibly other constraints to achieve greater stability). Second, the sensitivity to noise increases greatly with an increase in the number of degrees of freedom. So, for example, although greater regional information could be obtained with greater number of multiple dipoles, the results could actually become useless if too large a number were selected. At present, the number of dipoles that can be satisfactorily described in an inverse process, in electrocardiography, is under 10..
THE INVERSE PROBLEM WITH
THE MODELING METHOD
1
FOR THE SOURCE
The model should have a limited
number of independent variables
2
FOR THE VOLUME CONDUCTOR
The accuracy of the conductor model
must be as good as or better than
that of the source model
3
INDEPENDENT MEASUREMENTS
ARE MADE AS THE SOURCE MODEL
HAS INDEPENDENT VARIABLES
Now we have as many equations
as we have independent variables
and the source model may be evaluated
A NEW QUESTION, NAMELY:
4
Fig. 7.9. Solution of the inverse problem based on the modeling method.
 As pointed out previously, from a theoretical standpoint the inverse problem has no unique solution. Added to this uncertainty is one based on the limitations arising from the limited data points and the inevitable contamination of noise. However, solutions are possible based on approximations of various kinds, including purely empirical recognition of signal patterns. Unfortunately, at this time, generalizations are not possible. As might be expected, this subject is currently under intense study.


